The PC has 32GB of memory, but it consumes a lot of memory and the operation of the PC itself becomes heavy. Once you drop the ink drop, it will return to its original state.
Usage environment
Platform: macOS
Platform version: macOS 11.4
App Version: 5.4.1
Reproduction method
I think that this symptom often occurs when the PC is put to sleep and released.
Thank you for reporting it.
That’s weird.
It is usually around 200 MB or so in my environment, where I’m running it all day long.
I can’t reproduce it at the moment.
Plugins could cause that issue, so please try disabling them.
I’ll keep that in mind and check the memory usage.
Thank you very much.
OK.
I restarted Inkdrop earlier and it was okay for a while, but when I checked it now, it was a strange number.
Try stopping the plugin once.
Thanks for letting me know.
So, it happens randomly.
The issue seems to depend on your environment or your account because I haven’t had such an issue after getting your report.
But it looks like it happens in the main process, not in the renderer process.
I guess it might be something to do with the database or the full-text search indexing.
If so, you should be able to reproduce by re-syncing data from scratch.
Could you try the following steps?
Back up your data and copy the backup files to somewhere just in case
Okay, so, the issue didn’t happen when performing the full sync. That means that it is not related to the full-text indexing at least.
I guess it will probably happen again in the future.
But we don’t know how to reproduce it at the moment.
I’m experiencing a similar problem. My Mac uses 11GB of memory for Inkdrop, causing momentary freezes. This issue frequently occurs when I save my large notes (2,673 lines). Although restarting Inkdrop temporarily solves the problem, it resurfaces within an hour. Are there specific factors I should consider while trying to identify the root cause of this issue?
@Seito_Tanaka Thanks for bringing my attention to that.
I suspect that it happens during parsing JSON when transferring data from the main process to the renderer process because JSON.parse is not memory efficient.
In the next version, I’ll use structuredClone instead to avoid the issue.
Let’s see if it solves the issue!
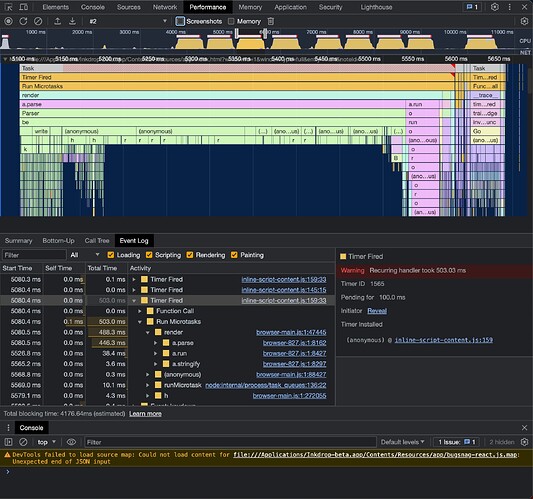
I tried beta, and my memory is fine so far. Another thing I noticed is that when I enter a key like “- aaa,” the drawing seems to stop for a moment. When I look at the profiler, it looks like the parse function is running for about 500ms. I hope this will be of some help.
@Seito_Tanaka Good to know that it is running fine so far.
Regarding the performance, can you give me a reproducible note content? I guess it’d be another issue, so we could discuss on a separate topic.